
ISSN: 1550-7521
ISSN: 1550-7521
Mr. Sivanagaraju Akki*1, Dr. E Uma Reddy2
1 Assistant Professor of Management Science, CVR College of Engineering, Hyderabad 2 Associate Professor of Management Science, CVR College of Engineering, Hyderabad
Received: 18-Jul-2022, Manuscript No. gmj-22-69449; Editor assigned: 20-Jul-2022, Preqc No. gmj-22-69449; Reviewed: 03-Aug-2022, QC No. gmj-22-69449; Revised: 08-Aug-2022, Manuscript No. gmj-22-69449(R); Published: 15-Aug-2022, DOI: 10.36648/1550-7521.20.53.317
Visit for more related articles at Global Media Journal
Indian banking sector is vast and provides various investment category, mutual fund is one of those many investments. This paper aims to evaluate, analyse, compare and rank small cap direct growth scheme of four selected banks (Axis Small Cap fund direct Growth option, Kotak Small Cap Fund Direct Growth Option, ICICI Prudential Small Cap Fund Direct Growth option and HDFC Small Cap fund Direct Growth Option) on basis of their financial performance. For which secondary data was extracted from the fact sheets of the company, for period of 3 years. To fulfil the purpose of the study the daily NAVs of the mutual funds has been analyzed through Sharpe’s Ratio and Treynor’s Ratio. The results revealed that Kotak Mahindra small cap direct option growth plan was found to be top ranker in Treynor Ratio while the ranking of Sharpe ratio kept on changing year by year.
Banks; Mutual Fund; Small Cap Direct Growth Option; NAV
Mutual fund history in India started in the year 1963 with the formation of company named Union Trust of India (UTI). This was a joint initiative between the Government of India and Reserve bank of India. The objective behind the formation of the company was to guide the small investors who aimed to buy shares, debentures and other financial products in large companies. The first ever Mutual fund Scheme launched by UTI in the country was in 1964 known as the Unit Scheme 1964 [1].
Impact of Covid -19 on Mutual Fund Industry
The extra-ordinary progress of Indian mutual fund industry can be seen in the growth of its Asset under Management (AUM) from Rs.25 crores in 1964 to Rs.22.26 lakh crores in March 2020. But the outbreak of the pandemic COVID-19 has affected the mutual fund industry.
It was observed that the New Fund offers (NFO) has decreased insignificantly after the outbreak. The number of NFOs was six in February 2020, which further dropped to just one in March 2020 and nil in April 2020. This decline was due to weak market sentiments and declining investor confidence.
The overall industry AUM has decreased by 6.91% in April 2020 compared to April 2019 and Individual investors hold 52.1% of industry assets in April 2020 compared to 54.7% in April 2019. The value of assets held by individual investors has decreased by 11.35% in April 2020 compared to April 2019. Much of the damage was because of outflows in the debt segment that saw the highest outflows in the Indian Debt Mutual Fund segment in a single financial year. Equity investment base managed by Mutual Funds also got cut by a quarter. Nevertheless, the Indian mutual fund industry has the spirit to overcome the situation [2].
Mutual Fund
Mutual Fund is a trust that collects money from a number of investors who share a common investment objective and then this gathered money is invested by the fund manager into specific securities i.e., stocks or bonds or any other financial instrument. A professional fund manager, who is not only responsible for implementing a fund’s investing strategy but also managing its portfolio trading activities, manages the fund thus pooled. Each investor in the mutual fund participates in the gain or loss of the fund based upon the number of shares owned by him [3].
Mutual fund schemes provide excellent opportunities to people to invest a small amount, which will ultimately grow like anything in the period of 15 to 20 years of their investments. The value of a share of the mutual fund is known as the net asset value per share (NAV) which is calculated daily based on the total value of the fund divided by the number of shares currently issued and outstanding by the company [4].
Types of Mutual Fund
Equity funds: Also Known as Growth funds, these funds allow the investor to participate in stock markets. The primary objective of this fund is wealth creation or capital appreciation. They have the potential to generate higher return and are best for long term investments.
Debt Funds: These invest in Fixed Income Securities, like Government Securities or Bonds, Commercial Papers and Debentures, Bank Certificates of Deposits and Money Market instruments like Treasury Bills, Commercial Paper, etc. Debt funds are relatively safer investments and are suitable for Income Generation.
Hybrid Funds: These invest in both Equities and Fixed Income, thus offering the best of both, Growth Potential as well as Income Generation [5].
Quantitative Measures Used To Evaluate Mutual Funds
Net Asset Value: NAV refers to the actual value of a unit in a mutual fund scheme on a particular day. NAV of a scheme tells how much each unit is worth. It is considered as the simplest measure of performance of a mutual fund. It is calculated as;
Risk Free Rate of Return (Rf): It represents those securities which provide a minimum guaranteed return with no risk.
Market Index: Market index is considered as the benchmark of any mutual fund scheme. If the market index of a scheme is less than the NAV, than it is said that the scheme is selling at a discount whereas if the market index is more than the NAV, scheme is said to be selling at a premium.
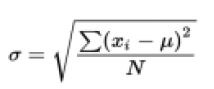
Standard Deviation: Standard deviation of a mutual fund scheme explains the deviation of
Actual return from expected return It measures the overall risk associated with the schemes.
NAV = (Assets - Liabilities) / Total number of outstanding shares
The higher the standard deviation the more risk the fund holds and it explains the historic volatility of the scheme. It is calculated
Beta: Beta represents the price changes of a fund in comparison with its benchmark. It explains the funds volatility to its benchmark. The beta measure assumes that the fund will move as its benchmark.
R-Squared: R-Squared or Ex-Mark indicates the extent to which the return of a mutual fund can be explained by the benchmark. The acceptable range of R-squared of equity mutual fund scheme lies between 80-90 percent. If the R-squared lies below 80% it indicates that the benchmark to which beta is compared is less reliable,
Sharpe Ratio: Sharpe ratio, also known as Reward to Variability ratio, measures the risk premium of a mutual fund scheme to the total amount of risk of the scheme. It helps in summarizing the risk return of the scheme in a single measure that compares the performance of different mutual fund schemes. It is calculated as;
Sharpe Ratio = (Rm – Rf) / StdDev
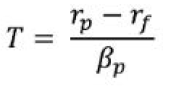
Treynor Ratio: Treynor ratio, also known as Reward to Volatility Ratio, measures the risk premium of a mutual fund scheme to the amount of systematic risk present in the index. It is calculated as;
Review Literature
Anuja Magdum, CA. Girish A. Samant (2019)
In this paper the researcher made an attempt to analyse twentyone equity mutual fund schemes of both public and private banks for the period of five years from 2013 to 2018. To analyse these schemes, capital asset pricing model was used and the results indicated that private sector banks are better performing, that is, more rewarding and moderately risky than public sector banks [6].
R. Kumar Gandhi Dr.R. Peruma (2015)
This study aimed to compare financial performance of equitydiversified schemes and equity mid-cap schemes among four selected banks. The researcher used statistical tools like Standard Deviation, Beta, Sharpe Ratio, Treynor Ratio, Jenson Ratio, and Information Ratio. The results of the study revealed that among the selected mutual fund schemes Canara Robeco Equity Diversified growth scheme is most suited in equity diversified mutual fund scheme and HDFC Capital Builder growth scheme in equity mid-cap mutual fund scheme [7].
Pradeep K. Gupta and M. S. Annapoorna (2013)
The main objective of the paper was to compare financial performance of mutual fund schemes ranked by CRISIL with SBI domestic term deposit rates for the period 2008 to 2013. The tools used included average and return rates, the results revealed that most of the selected mutual fund provided less return than SBI domestic tern deposits.
Conceptual Framework
This study has taken one mutual fund scheme of four different banks (Axis Small Cap fund direct Growth option, Kotak Small Cap Fund Direct Growth Option, ICICI Prudential Small Cap Fund Direct Growth option and HDFC Small Cap fund Direct Growth Option) as sample. The aim of the paper is to evaluate, analyze, compare and rank the scheme on basis of their financial performance. All the data has been collected from secondary sources like fact sheets of the company, journals, research papers, published sources. The data used for analysis has been taken for period of 3 years (1st April 2019- 31st March 2022). For the purpose of this study the daily NAVs of the mutual funds has been taken and Sharpe’s Ratio and Treynor’s Ratio are used to rank and analyse the mean returns of the company. For the value of risk-free rate of return the study has taken three-year 91 days treasury bills issued by the government of India and the beta measure assumes that the fund will move as its benchmark and thus it is taken as;
In this study, NIFTY SMALL CAP 100 TR has been considered benchmark for all four selected small cap mutual fund schemes.
Note: “Small Cap” funds that invest in small sized companies.
Objectives of the Study
1. To evaluate the performance of selected small cap direct growth mutual fund schemes.
2. To compare the performance of selected small cap direct growth mutual fund schemes.
3. To analyse the performance of selected mutual funds scheme using Sharpe model and Treynor’s model.
Research Methodology
Hypothesis
H01: The difference of mean returns among the selected Small Cap Direct Plan Growth Option is equal to zero.
HA1: The difference of mean returns among the selected Small Cap Direct Plan Growth Option is different from zero.
H02: The difference of Sharpe’s Ratio among the selected Small Cap Direct Plan Growth Option is equal to zero.
HA2: The difference of Sharpe Ratio’s among the selected Small Cap Direct Plan Growth Option is different from zero.
H03: The difference of Treynor’s Ratio among the selected Small Cap Direct Plan Growth Option is equal to zero.
HA3: The difference of Treynor’s Ratio among the selected Small Cap Direct Plan Growth Option is different from zero.
Research Design: This study is exploratory and comparative in nature. It focuses on comparing the performance of selected mutual fund schemes for the period of three years from 2018- 2021.
Data Source: This study is based on the secondary data extracted from the website of Association of Mutual Funds in India.
Sample Design: The sample consists of 3 years of data of selected mutual fund small cap direct growth scheme from financial year 2019-20 to 2021-22.
Statistical Tools: For the fulfilment of the objective, this study has taken daily NAV of all the four selected mutual fund schemes of 3years, from 1st April 2019 to 31st March 2022 and for the hypothesis testing the collected data has been analyzed by different tools like; Simple Mean, Standard Deviation, Sharpe Model and Treynor’s Model
Data Analysis and Interpretation
(Table 1).
| Schemes | Mean NAV | Rf | Standard Deviation | Sharpe Ratio | Rank | Treynor Ratio | Rank |
|---|---|---|---|---|---|---|---|
| Kotak Mahindra | 77.29126 | 6.19 | 5.466112 | 13.00765 | III | 71.10126 | I |
| Axis Bank | 28.25591 | 6.19 | 0.991625 | 22.25228 | I | 22.06591 | III |
| HDFC | 46.18668 | 6.19 | 2.104656 | 19.0039 | II | 39.99668 | II |
| ICICI Prudential |
25.43996 | 6.19 | 2.191344 | 8.784547 | IV | 19.24996 | IV |
Table 1. Analysis of Data for the Year 2019-2020.
From Table 1 it can interpret that by comparing the selected different small cap direct growth schemes, it can be stated that in the financial year 2019-20, in terms of NAV with 77.29125911 and with Treynor Ratio of 71.10125911. Kotak Mahindra was the best performing mutual fund amongst the selected schemes, whereas from the view point of Sharpe ratio i.e., on analysing the return along with the total risk the performance of Axis Bank was leading, followed by HDFC, Kotak Mahindra and ICICI prudential (Tables 2 and 3).
Schemes |
Mean NAV | Rf | Standard Deviation | Sharpe Ratio | Rank | Treynor Ratio | Rank |
|---|---|---|---|---|---|---|---|
| Kotak | 76.38392 | 4.36 | 6.192544 | 11.63075 | I | 72.02392 | I |
| Mahindra | |||||||
| Axis Bank | 32.13029 | 4.36 | 2.813177 | 9.871503 | III | 27.77029 | III |
| HDFC | 42.1748 | 4.36 | 3.885416 | 9.732497 | IV | 37.8148 | II |
| ICICI Prudential | 25.92069 | 4.36 | 2.003384 | 10.76214 | II | 21.56069 | IV |
Table 2. Analysis of Data for Year 2020-21.
Schemes |
Mean NAV | Rf | Standard Deviation | Sharpe Ratio | Rank | Treynor Ratio | Rank |
|---|---|---|---|---|---|---|---|
| Kotak Mahindra | 90.71185 | 3.18 | 22.67564 | 3.860172 | IV | 87.53185 | I |
| Axis Bank | 36.67823 | 3.18 | 6.604417 | 5.072094 | I | 33.49823 | III |
| HDFC | 42.53575 | 3.18 | 9.037174 | 4.354874 | II | 39.35575 | II |
| ICICI Prudential | 28.1104 | 3.18 | 6.420344 | 3.883033 | III | 24.9304 | IV |
Table 3. Analysis of Data for Year 2021-22.
From Table 3, of comparison among the selected different small cap direct growth scheme it can be stated that in the financial year 2019-20, in terms of NAV with 90.711852 and with Treynor Ratio of 87.531852, Kotak Mahindra was the best performing mutual fund amongst the selected schemes, whereas from the view point of Sharpe ratio performance of Kotak Mahindra was the least and Axis Bank was leading, followed by HDFC, and ICICI prudential.
1. For the period from 2019-20 to 2021-22, all the four small cap direct growth mutual fund schemes have shown a positive return and at a growth rate except HDFC small cap direct growth mutual fund scheme which has shown a decreasing trend in between 2019-20 and 2020- 21.
2. Axis bank small fund direct growth scheme is the most well performed scheme based on risk-return measure in threeyear period.
3. Although Kotak Mahindra small cap mutual fund has shown the highest mean return and Treynor Ratio, but the standard deviation of this scheme is very high in all three years, representing the volatility of the scheme, so only risk taker investors are suggested to invest in this scheme.
4. ICICI prudential small cap direct growth scheme has been ranked last in all three years based on Treynor Ratio but this scheme has shown a slow but consistent growth over the period.
Mutual fund provides a wide variety of schemes among different categories, depending upon the risk-return portfolio. The four selected schemes in small cap category were ranked among top schemes by CSRIL rating. The entire selected scheme has a positive and growing trend over the period. On evaluating their performance, it was revealed that Kotak Mahindra small cap direct option growth plan was found to be top ranker in Treynor Ratio, while the ranking of Sharpe ratio kept on changing year by year the major reason between the rank of these two ratios were due to the consideration of standard deviation, which explains the deviation of daily return from the mean return. This study has used various methods and techniques to evaluate the performance as well as risk and return of selected schemes that will help the investors to invest their capital in a rational way and gain effectively. Further, this study will also attract other researchers to work in this area of study with other schemes and plans of mutual fund companies.
Indexed at, Google Scholar, Crossref
Copyright © 2025 Global Media Journal, All Rights Reserved